Chapter 7
Airspace and hazards
Besides traffic, the map can show temporary flight restrictions, drone NOTAMs, LAANC altitudes, tall obstacles, power lines and pipelines. Each is a rail button: tap to show or hide, long-press for its settings.
All of these use United States data. See Features that work only in the United States.
7.1Temporary flight restrictions
United States only
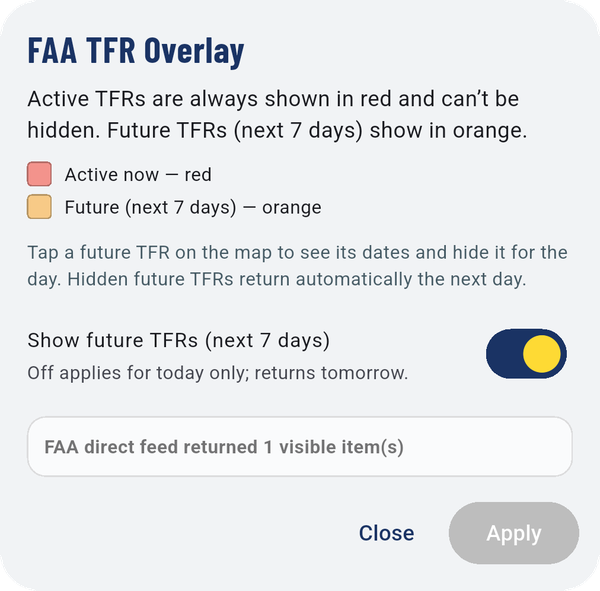
- Active TFRs are always shown in red and can't be hidden.
- Future TFRs (the next 7 days) are shown in orange. Turn off Show future TFRs (next 7 days) to hide them for today; they return tomorrow.
Tap a future TFR on the map to see its dates and hide it for the day.
7.2Drone NOTAMs
United States only
Tap NOTAM to show or hide NOTAMs that affect drone (UAS)
flights. They're drawn in teal. Tap one on the map to read it.
7.3LAANC altitudes
United States only
The LAANC grid shows the maximum altitude the FAA will approve in each square near controlled airports.
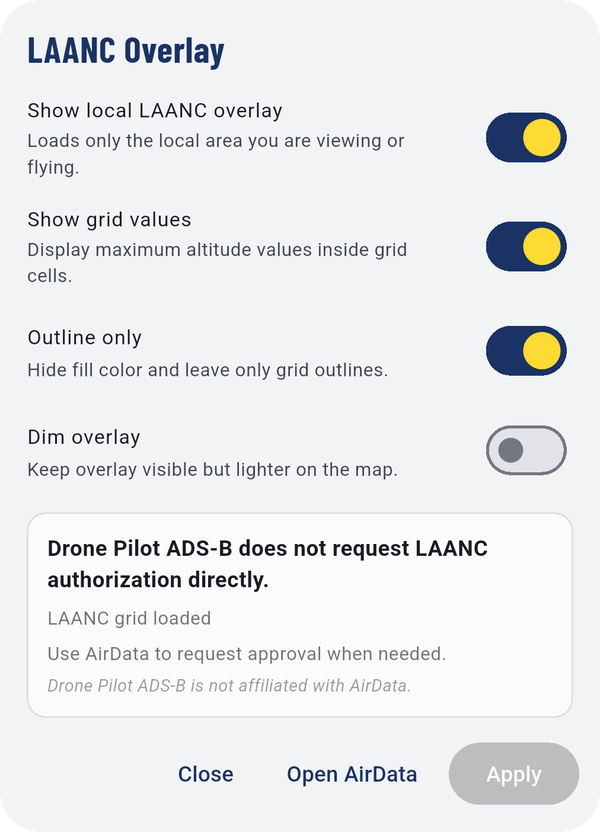
- Show local LAANC overlay: loads only the area you're viewing or flying.
- Show grid values: the altitude number inside each square.
- Outline only: hides the fill, leaving only the grid lines.
- Dim overlay: lighter on the map.
Note
Drone Pilot ADS-B doesn't request LAANC authorization. Open AirData takes you to AirData, where you can. Drone Pilot ADS-B isn't affiliated with AirData.
7.4Obstacles
United States only
Towers, antennas, buildings, cranes and wind turbines from the FAA obstacle file.
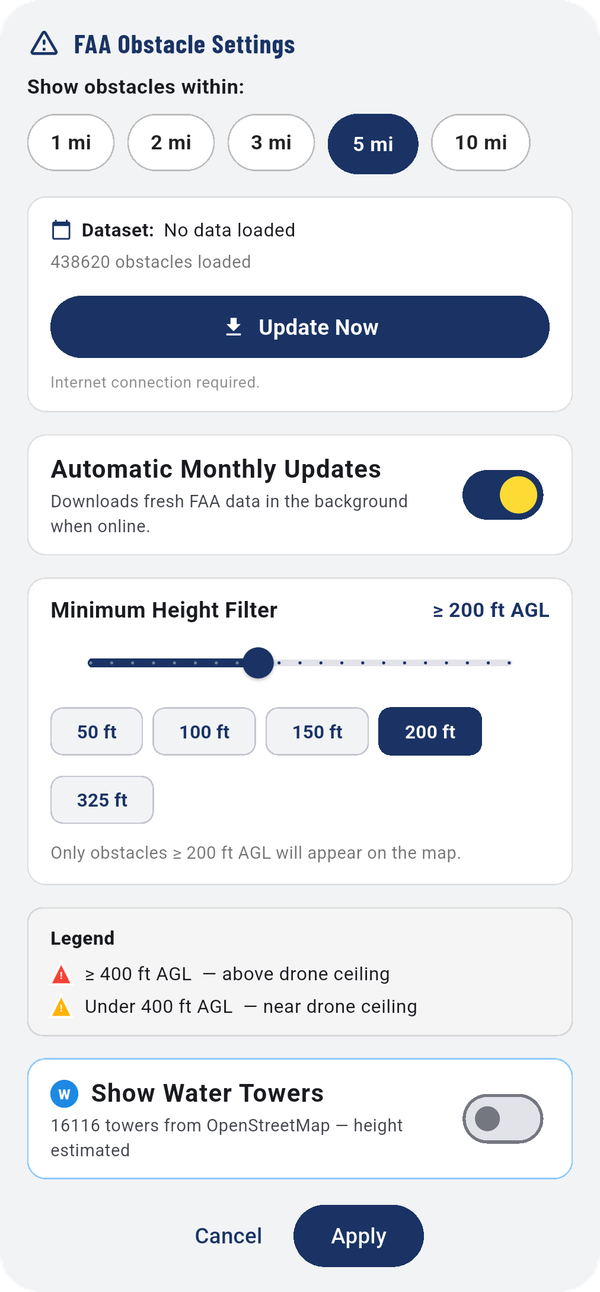
- Show obstacles within: 1, 2, 3, 5 or 10 miles.
- Dataset and Update Now: the date of the FAA file, and a button to download the latest (needs internet).
- Automatic Monthly Updates: keeps the file fresh in the background.
- Minimum Height Filter: hide obstacles shorter than this. Quick buttons for 50, 100, 150, 200 and 325 ft.
- Show Water Towers: water towers from OpenStreetMap, with estimated heights.
| Marker | Meaning |
|---|---|
| Red triangle | 400 ft AGL or taller, above the drone ceiling |
| Amber triangle | Under 400 ft AGL, near the drone ceiling |
7.5Power lines
United States only
High-voltage transmission lines, colored by voltage. Higher voltage usually means taller towers.
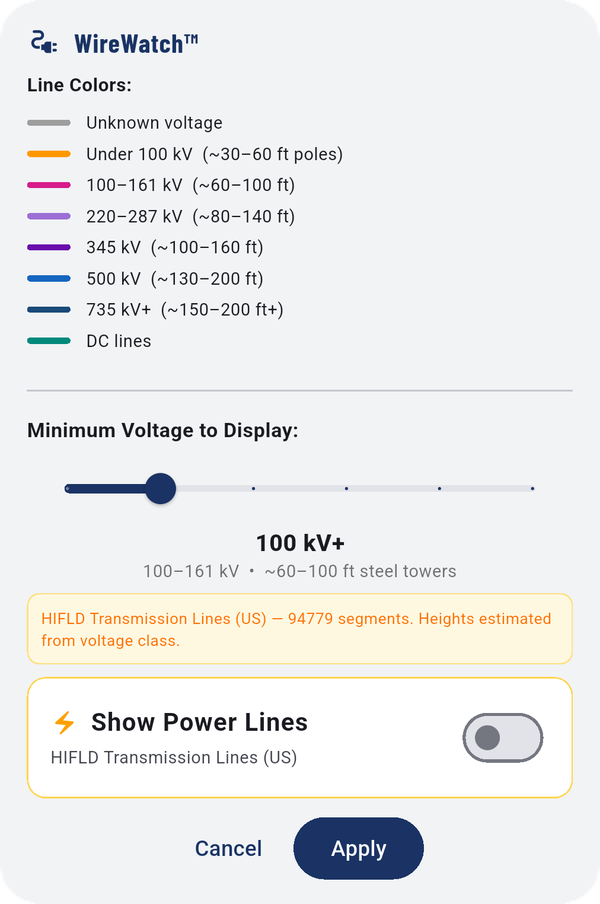
Minimum Voltage to Display hides lower-voltage lines; the label under the slider shows the typical tower height for that voltage. Turn the layer on with Show Power Lines. Heights are estimated from the voltage class.
7.6Pipelines
United States only
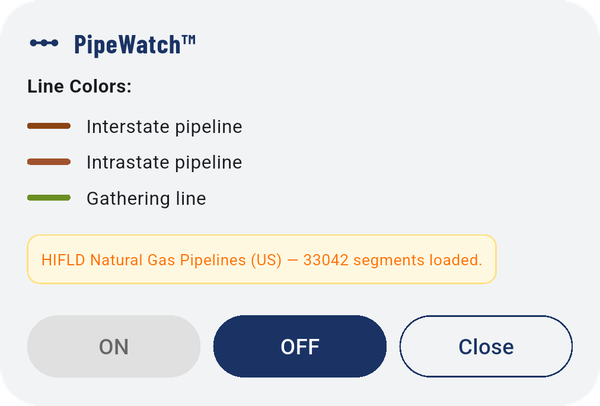
Natural gas pipelines: interstate, intrastate and gathering lines, each in its own color.
7.7Add your own facility or obstacle
Long-press the map where you want it. Add to Map offers:
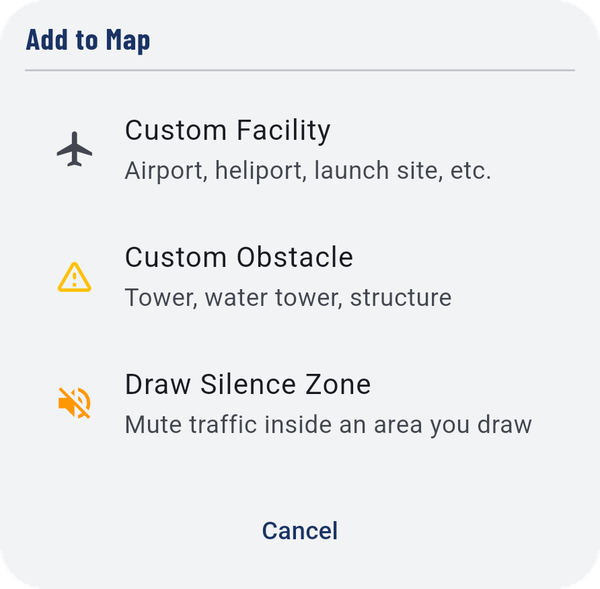
- Custom Facility: an airport, heliport, launch site or similar that isn't in the FAA database.
- Custom Obstacle: a tower, water tower or structure you know about.
- Draw Silence Zone: an area where traffic stays quiet.